
Canvas UI - Designing Dashboards
Combining multiple layers together can be a powerful way to display different sources of related content side-by-side. These are known as dashboards and can give an at-a-glance view of the status of a complex design, project or system.
This tutorial uses the Layouts feature of ICE for defining regions on the canvas. Layouts can be created and modified using the Desktop UI.
Tutorial Video
Designing Dashboards
Creating a Simple Dashboard
This section will describe creating a simple dashboard consisting of 4 WebViews pointing to news channels.
Press the Add Content button and select New > WebView. Repeat this 3 more times so that you have 4 WebViews.
For one of the WebViews, set the URL to http://www.bbc.co.uk/news .
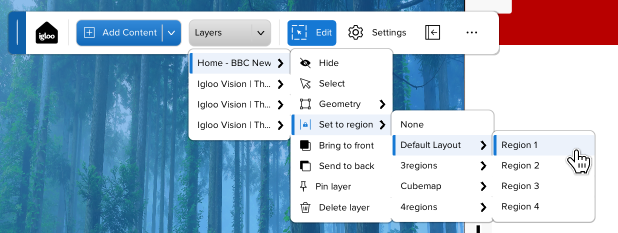
In the Layers action menu on the Canvas Toolbar, set the BBC News layer to Region 1 in the Default Layout. This will move the layer to a specific area of the Canvas.
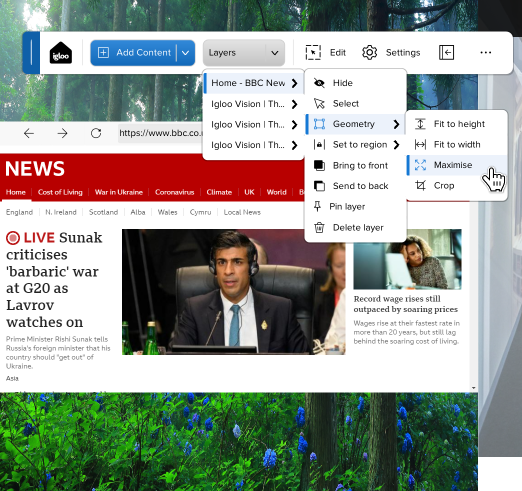
Next, select Maximise from the Geometry menu. This will resize the WebView so that it fills the region it is contained in.
Set the URLs of the other WebViews to the following:
http://www.bbc.co.uk/news/technology
Set the WebViews to Region 2, Region 3 and Region 4 of the Default Layout and Maximise each one. This will give a WebView dashboard which fills the entire canvas.
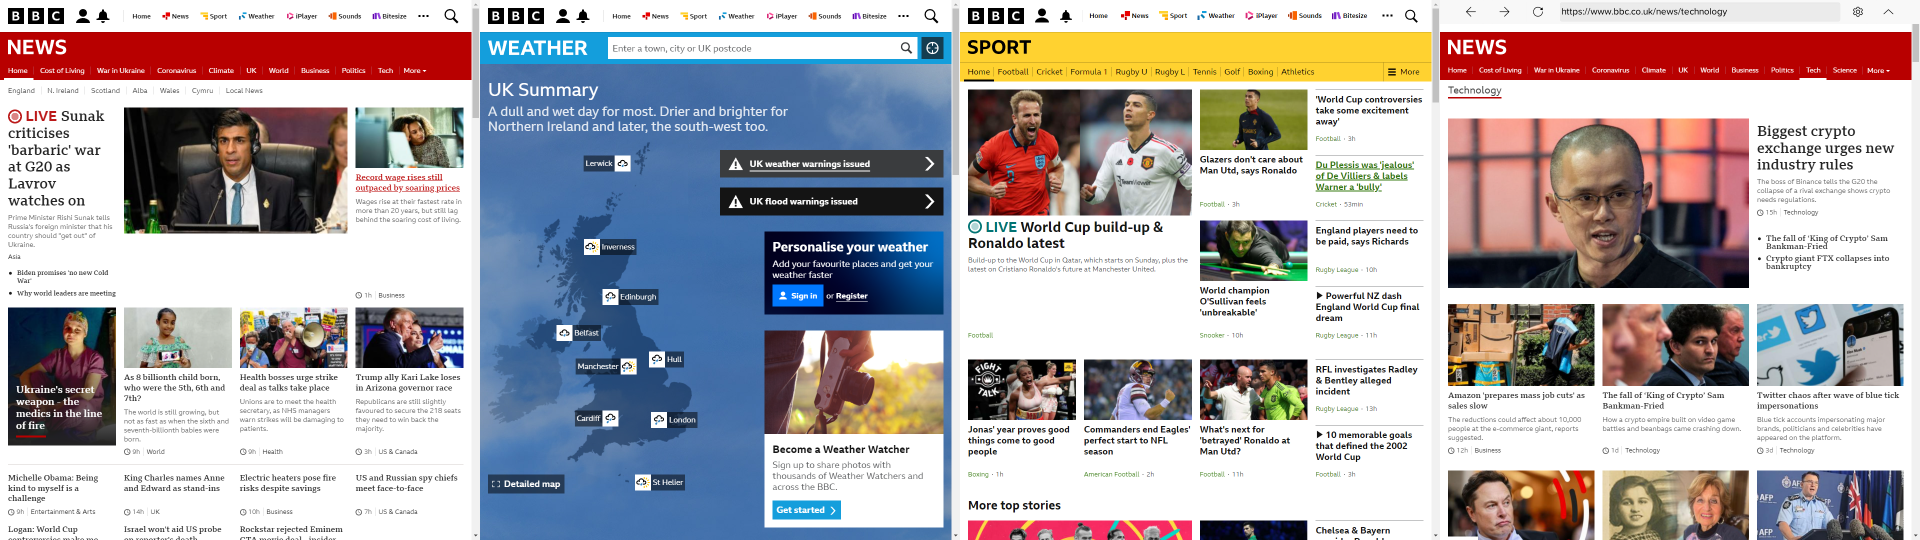
News Dashboard consisting of 4 WebViews
Once completed, save all the WebViews into a single session, called ‘News Dashboard'.
Next Section: Canvas UI - Exploring Google Street View